Reposted from Kristina Chodorow's blog.
Bazel lets you see a graph of your build dependencies. It could help you debug things, but honestly it's just really cool to see what your build is doing.
To try it out, you'll need a project that uses Bazel to build. If you don't have one handy, here's a tiny workspace you can use:
$ git clone https://github.com/kchodorow/tiny-workspace.git
$ cd tiny-workspace
Make sure you've downloaded and installed Bazel and have the following line to your ~/.bazelrc:
query --package_path %workspace%:[path to bazel]/base_workspace
Now run bazel query in your tiny-workspace/ directory, asking it to search
for all dependencies of //:main and format the output as a graph:
$ bazel query 'deps(//:main)' --output graph > graph.in
This creates a file called graph.in, which is a text representation of the
build graph. You can use dot (install with sudo apt-get install graphviz)
to create a png from this:
$ dot -Tpng < graph.in > graph.png
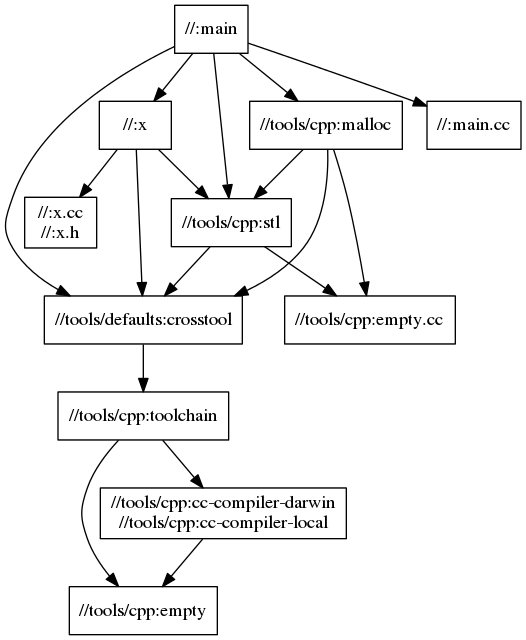
If you open up graph.png, you should see something like this:

You can see //:main depends on one file (//:main.cc) and four targets
(//:x, //tools/cpp:stl, //tools/default:crosstool, and
//tools/cpp:malloc). All of the //tools targets are implicit dependencies
of any C++ target: every C++ build you do needs the right compiler, flags, and
libraries available, but it crowds your result graph. You can exclude these
implicit dependencies by removing them from your query results:
$ bazel query --noimplicit_deps 'deps(//:main)' --output graph > simplified_graph.in
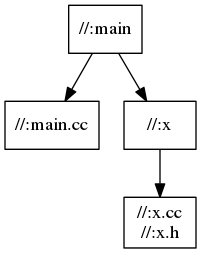
Now the resulting graph is just:

Much neater!
If you're interested in further refining your query, check out the docs on querying.