Probably every Bazel user has experienced builds that were slow or slower than anticipated. In this blog post we will provide a list of options on how to gain more insights into the performance of a Bazel build.
Analyzing build target performance
Often we are concerned with how to improve the performance of individual builds. Some relevant cases of significance:
Core developer targets that are frequently iterated on and (re)built.
Common libraries widely depended upon by other targets.
A representative target from a class of targets (e.g. custom rules), diagnosing and fixing issues in one build might help to resolve issues at the larger scale.
Extracting metrics
There are a few main ways to extract metrics from your Bazel builds, namely:
Build Event Protocol (BEP)
Bazel’s query/cquery/aquery commands
JSON trace profiles
Execution log
Execution graph log
Bazel bench
Build Event Protocol (BEP)
Bazel outputs a variety of protocol buffers buildeventstream.proto through the Build Event Protocol (BEP), which can be aggregated by a backend specified by you. Depending on your use cases, you might decide to aggregate the metrics in various ways, but here we will go over some concepts and proto fields that would be useful in general to consider.
Bazel's query / cquery / aquery commands
Bazel provides 3 different query modes (query, cquery and aquery) that allow users to query the target graph, configured target graph and action graph respectively. The query language provides a suite of functions usable across the different query modes, that allows you to customize your queries according to your needs.
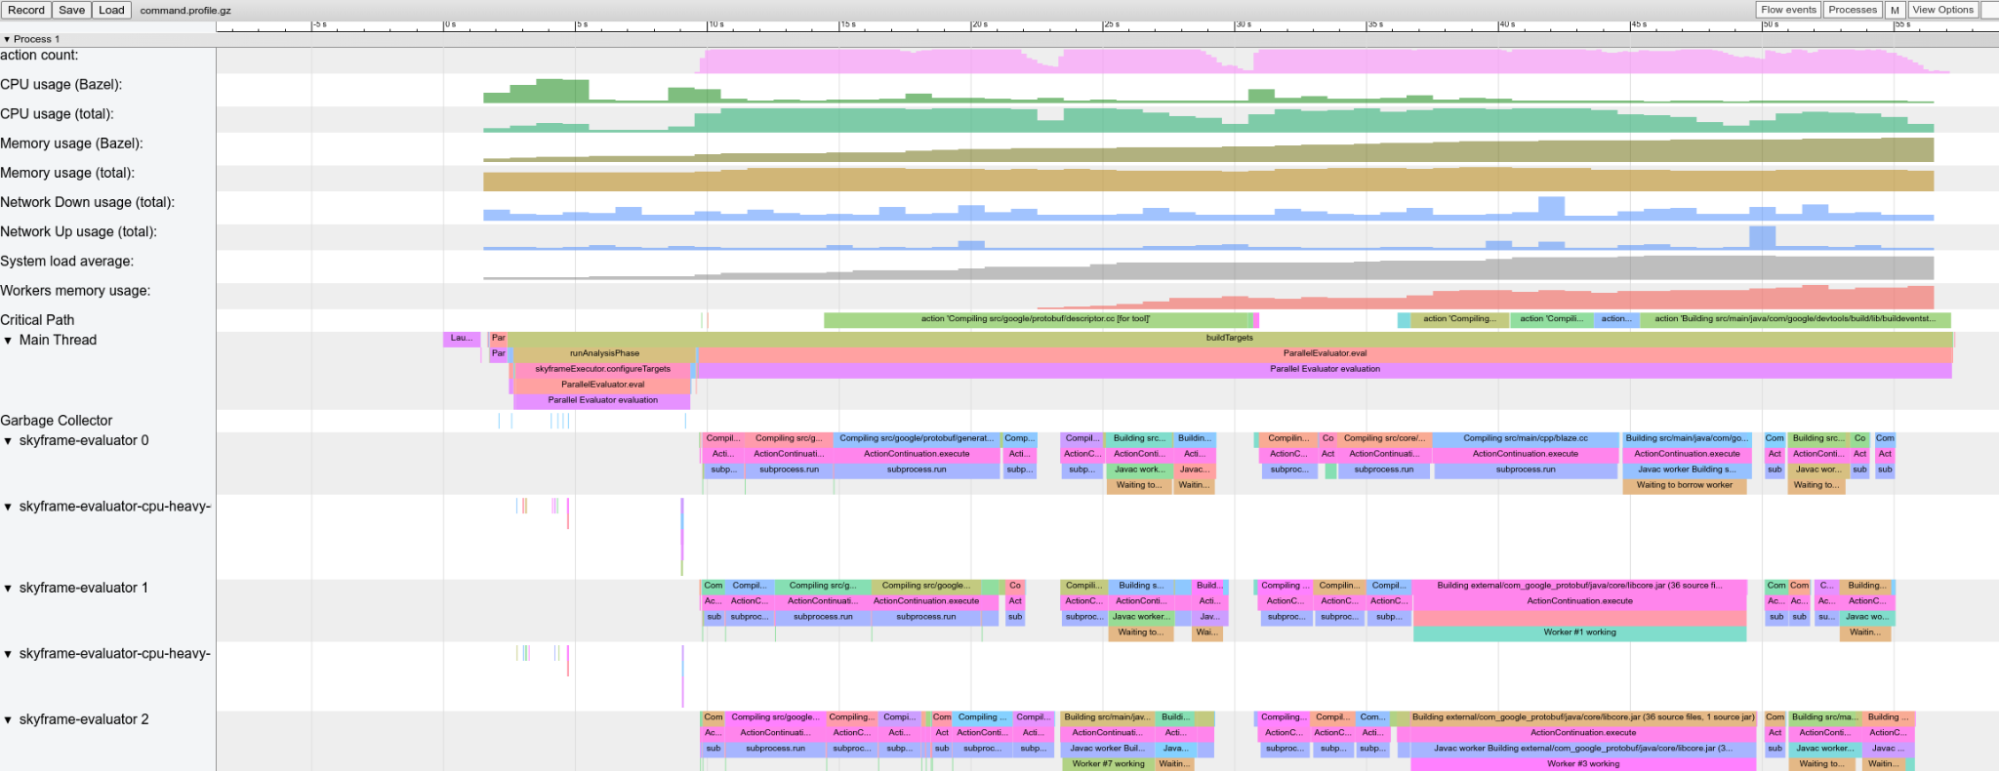
JSON Trace Profiles
For every Bazel invocation, Bazel writes a trace profile in JSON format. This can be very useful to quickly understand what Bazel was spending time on during the invocation. As we describe in our
documentation, you can load this profile into chrome://tracing or analyze/postprocess it with external tools such as jq.
An example usage of jq to extract all durations of the sandbox creation step in local action execution:
$ zcat $(../bazel-6.0.0rc1-linux-x86_64 info output_base)/command.profile.gz | jq '.traceEvents | .[] | select(.name == "sandbox.createFileSystem") | .dur'
6378
7247
11850
13756
6555
7445
8487
15520
[...]
EngFlow recently open sourced a Bazel Invocation Analyzer which is consuming a trace profile and suggesting improvements. We are excited to learn more about it during their BazelCon presentation.
Execution Log
The execution log can help you to troubleshoot and fix missing remote cache hits due to machine and environment differences or non-deterministic actions. If you pass the flag
--experimental_execution_log_spawn_metrics (available from Bazel 5.2) it will also contain detailed spawn metrics, both for locally and remotely executed actions. You can use these metrics for example to make comparisons
between local and remote machine performance or to find out which part of the spawn execution is consistently slower than expected (for example due to queuing).
Execution Graph Log
While the JSON trace profile contains the critical path information, sometimes you need additional information on the dependency graph of the executed actions. Starting with Bazel 6.0, you can pass the flags
--experimental_execution_graph_log and --experimental_execution_graph_log_dep_type=all to write out a log about the executed actions and their inter-dependencies.
This information can be used to understand the drag that is added by a node on the critical path. The drag is the amount of time that can potentially be saved by removing a particular node from the execution graph. The data helps you predict the impact of changes to the build and action graph before you actually do them.
Benchmarking with bazel-bench
Bazel bench is a benchmarking tool for Git projects to benchmark build performance in the following cases:
Project benchmark: Benchmarking two git commits against each other at a single Bazel version. Used to detect regressions in your build (often through the addition of dependencies).
Bazel benchmark: Benchmarking two versions of Bazel against each other at a single git commit. Used to detect regressions within Bazel itself (if you happen to maintain / fork Bazel).
Benchmarks monitor wall time, CPU time and system time and Bazel’s retained heap size.
It is also recommended to run Bazel bench on dedicated, physical machines that are not running other processes so as to reduce sources of variability.
Breaking down build performance
Bazel is complex and does a lot of different things over the course of a build, some of which can have an impact on build performance. This section attempts to map some of these Bazel concepts to their implications on build performance. While not extensive, we have included some examples of how to detect build performance issues through extracting metrics and what you can do to fix them. With this, we hope you can apply these concepts when investigating build performance regressions.
Clean vs Incremental builds
A clean build is one that builds everything from scratch, while an incremental build reuses some already completed work.
We suggest looking at clean and incremental builds separately, especially when you are collecting / aggregating metrics that are dependent on the state of Bazel’s caches (for example build request size metrics). They also represent two different user experiences. As compared to starting a clean build from scratch (which takes longer due to a cold cache), incremental builds happen far more frequently as developers iterate on code (typically faster since the cache is usually already warm).
You can use the CumulativeMetrics.num_analyses field in the BEP to classify builds. If num_analyses <= 1, it is a clean build; otherwise, we can broadly categorize it to likely be an incremental build - the user could
have switched to different flags or different targets causing an effectively clean build. Any more rigorous definition of incrementality will likely have to come in the form of a heuristic, for example looking at the number
of packages loaded (PackageMetrics.packages_loaded).
Deterministic build metrics as a proxy for build performance
Measuring build performance can be difficult due to the non-deterministic nature of certain metrics (for example Bazel’s CPU time or queue times on a remote cluster). As such, it can be useful to use deterministic metrics as a proxy for the amount of work done by Bazel, which in turn affects its performance.
The size of a build request can have a significant implication on build performance. A larger build could represent more work in analyzing and constructing the build graphs. Organic growth of builds comes naturally with development, as more dependencies are added/created, and thus grow in complexity and become more expensive to build.
We can slice this problem into the various build phases, and use the following metrics as proxy metrics for work done at each phase:
PackageMetrics.packages_loaded: the number of packages successfully loaded. A regression here represents more work that needs to be done to read and parse each additional BUILD file in the loading phase.TargetMetrics.targets_configured: representing the number of targets and aspects configured in the build. A regression represents more work in constructing and traversing the configured target graph.- This is often due to the addition of dependencies and having to construct the graph of their transitive closure.
- Use cquery to find where new dependencies might have been added.
ActionSummary.actions_created: represents the actions created in the build, and a regression represents more work in constructing the action graph. Note that this also includes unused actions that might not have been executed.- Use aquery for debugging regressions; we suggest starting with
--output=summarybefore further drilling down with--skyframe_state.
- Use aquery for debugging regressions; we suggest starting with
ActionSummary.actions_executed: the number of actions executed, a regression directly represents more work in executing these actions.- The BEP writes out the action statistics
ActionDatathat shows the most executed action types. By default, it collects the top 20 action types, but you can pass in the--experimental_record_metrics_for_all_mnemonicsto collect this data for all action types that were executed. - This should help you to figure out what kind of actions were executed (additionally).
- The BEP writes out the action statistics
BuildGraphSummary.outputArtifactCount: the number of artifacts created by the executed actions.- If the number of actions executed did not increase, then it is likely that a rule implementation was changed.
These metrics are all affected by the state of the local cache, hence you will want to ensure that the builds you extract these metrics from are clean builds.
We have noted that a regression in any of these metrics can be accompanied by regressions in wall time, cpu time and memory usage.
Usage of local resources
Bazel consumes a variety of resources on your local machine (both for analyzing the build graph and driving the execution, and for running local actions), this can affect the performance / availability of your machine in performing the build, and also other tasks.
Time spent
Perhaps the metrics most susceptible to noise (and can vary greatly from build to build) is time; in particular - wall time, cpu time and system time. You can use bazel-bench to get a benchmark
for these metrics, and with a sufficient number of --runs, you can increase the statistical significance of your measurement.
Wall time is the real world time elapsed.
- If only wall time regresses, we suggest collecting a JSON trace profile and looking for differences. Otherwise, it would likely be more efficient to investigate other regressed metrics as they could have affected the wall time.
Cpu time is the time spent by the CPU executing user code.
- If the cpu time regresses across two project commits, we suggest collecting a Starlark CPU profile. You should probably also use
--nobuildto restrict the build to the analysis phase since that is where most of the CPU heavy work is done.
- If the cpu time regresses across two project commits, we suggest collecting a Starlark CPU profile. You should probably also use
System time is the time spent by the CPU in the kernel.
- If system time regresses, it is mostly correlated with I/O when Bazel reads files from your file system.
System-wide load profiling
Using the --experimental_collect_load_average_in_profiler flag, the JSON trace profiler collects the system load average during the invocation.
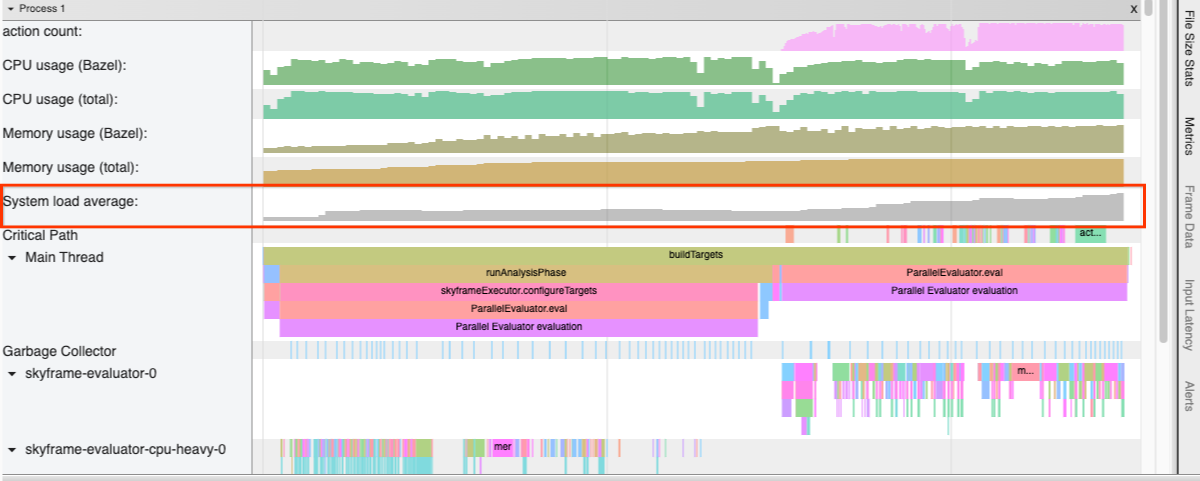
A high load during a Bazel invocation can be an indication that Bazel schedules too many local actions in parallel for your machine. You might want to look into adjusting --local_cpu_resources and --local_ram_resources, especially in
container environments (at least until #16512 is merged).
Monitoring Bazel memory usage
There are two main sources to get Bazel’s memory usage, Bazel info and the BEP.
bazel info used-heap-size-after-gc: The amount of used memory in bytes after a call toSystem.gc().- Bazel bench provides benchmarks for this metric as well.
- Additionally, there are
peak-heap-size,max-heap-size,used-heap-sizeandcommitted-heap-size(see documentation), but are less relevant.
BEP's
MemoryMetrics.peak_post_gc_heap_size: Size of the peak JVM heap size in bytes post GC (requires setting--memory_profilethat attempts to force a full GC).
A regression in memory usage is usually a result of a regression in build request size metrics, which are often due to addition of dependencies or a change in the rule implementation.
To analyze Bazel’s memory footprint on a more granular level, we recommend using the built-in memory profiler for rules.
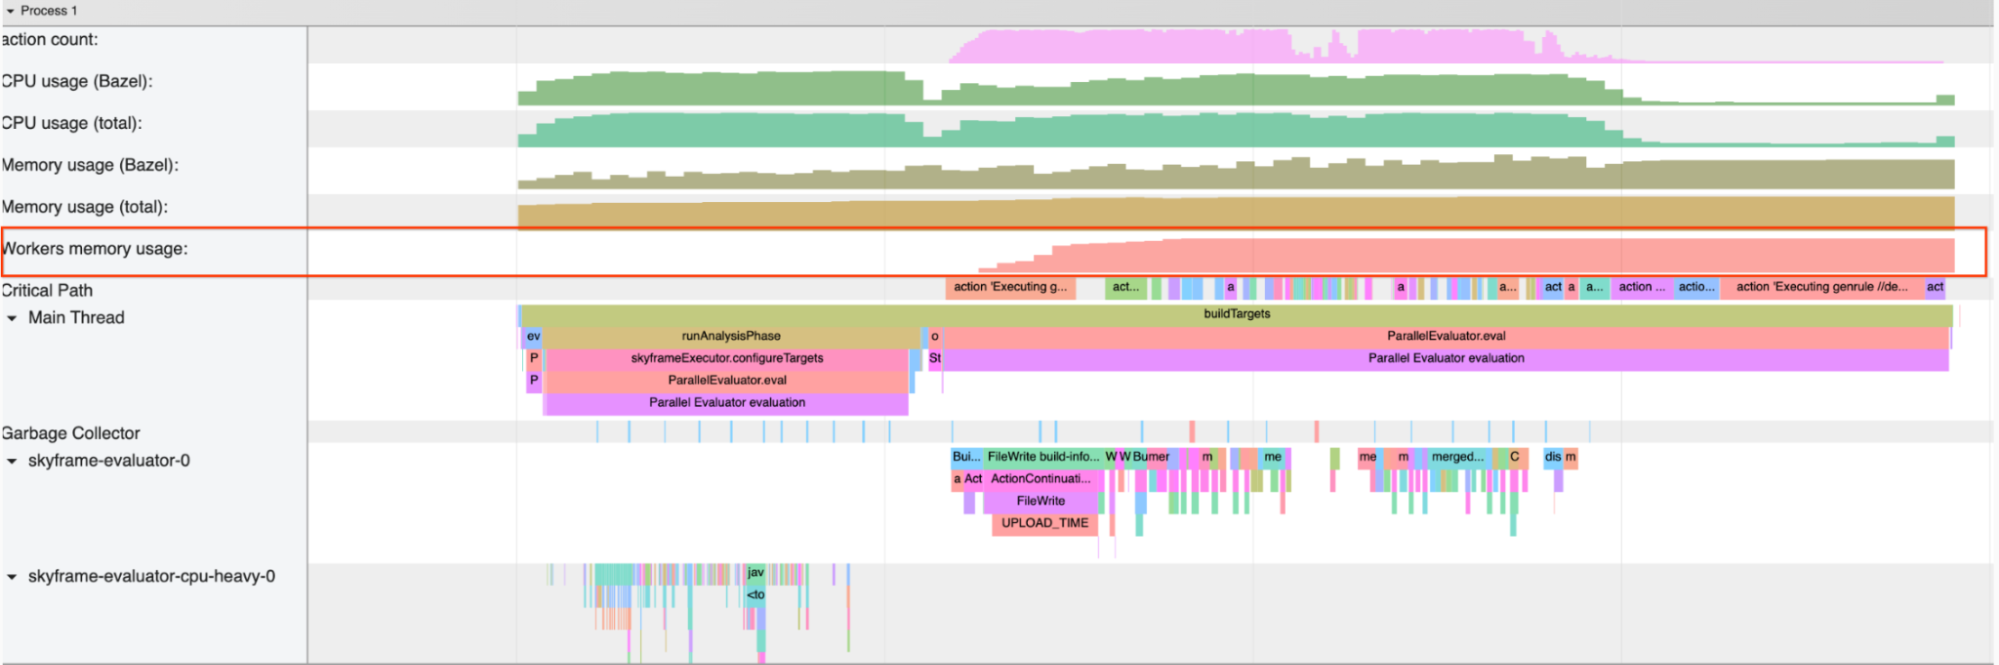
Memory profiling of persistent workers
While persistent workers can help to speed up builds significantly (especially for interpreted languages) their memory footprint can be problematic. Bazel collects metrics on its workers, in particular,
the WorkerMetrics.WorkerStats.worker_memory_in_kb field tells how much memory workers use (by mnemonic).
The JSON trace profiler also collects persistent worker memory usage during the invocation by passing in the --experimental_collect_system_network_usage flag (new in Bazel 6.0).
Lowering the value of --worker_max_instances (default 4) might help to reduce the amount of memory used by persistent workers. We are actively working on making Bazel’s resource manager and scheduler smarter so that such fine tuning will be required
less often in the future.
Monitoring network traffic for remote builds
In remote execution, Bazel downloads artifacts that were built as a result of executing actions. As such, your network bandwidth can affect the performance of your build.
If you are using remote execution for your builds, you might want to consider monitoring the network traffic during the invocation using the NetworkMetrics.SystemNetworkStats proto from the BEP
(requires passing --experimental_collect_system_network_usage).
Furthermore, JSON trace profiles allow you to view system-wide network usage throughout the course of the build by passing the --experimental_collect_system_network_usage flag (new in Bazel 6.0).
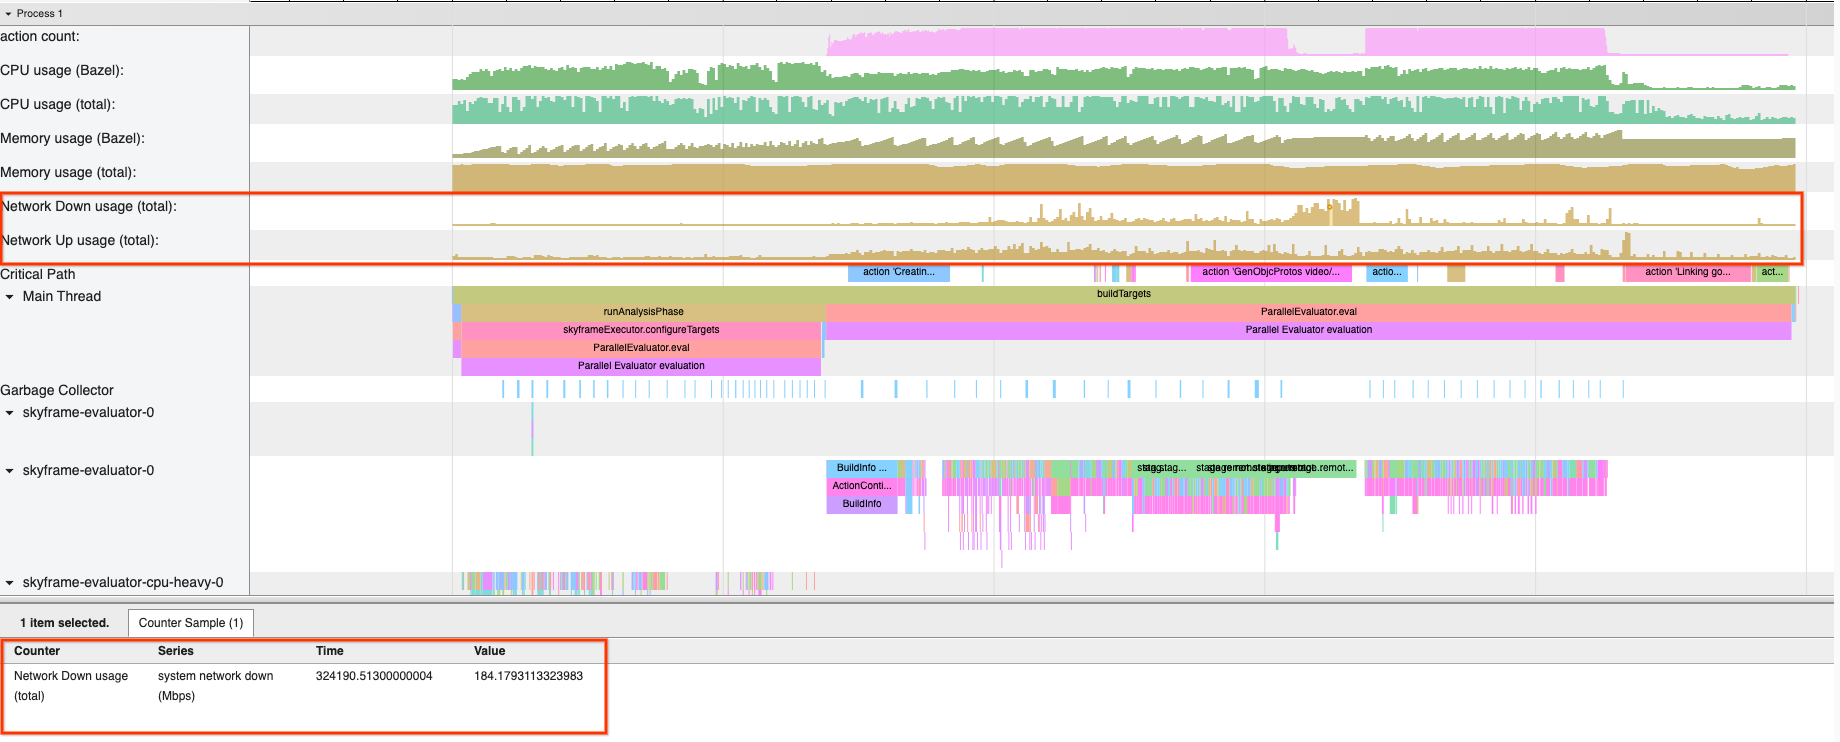
A high but rather flat network usage when using remote execution might indicate that network is the bottleneck in your build; if you are not using it already, consider turning on Build without the Bytes by passing --remote_download_minimal. This will speed
up your builds by avoiding the download of unnecessary intermediate artifacts.
As mentioned on our roadmap, we plan to turn it on by default in the near future - so if you experience any issues, please add your scenario to the tracking issue. Another option is to configure a local disk cache to save on download bandwidth.